

The number usually arrives dressed as bad news. A statistic in a newsletter, with a small red arrow next to it. A slide at a trade fair, clicked past while the speaker apologizes for the chart. A captioned post explaining that your own online store is over, that commerce now lives on marketplaces and everything else is a hobby with a checkout button. Behind all three of these sits the same figure: 83.4% of global ecommerce spending now flows through marketplaces, up from 81% two years earlier. It is a big number, and it knows it. Most days it is presented as the end of the discussion.
Meanwhile, this evening, the shop is open. Orders came in today – not a record, not a collapse. A customer who first bought in 2021 emailed to ask about a spare part. On the same screen sit two files. One is the marketplace settlement report: line items, deductions, a payout date sometime next week. The other is the shop’s own order export: names, addresses, what they bought, when they came back. Both files are called sales. Only one of them has the customers’ names in it.
So either the big number is lying, or it is answering a different question. This article takes the second option. It counts the same economy twice – once from the shopper’s side, once from the firm’s side. One count is baskets. The other is businesses. And it turns out the famous figure and the merchant’s own books come from two ledgers that never measured the same thing.
What the big number actually counts
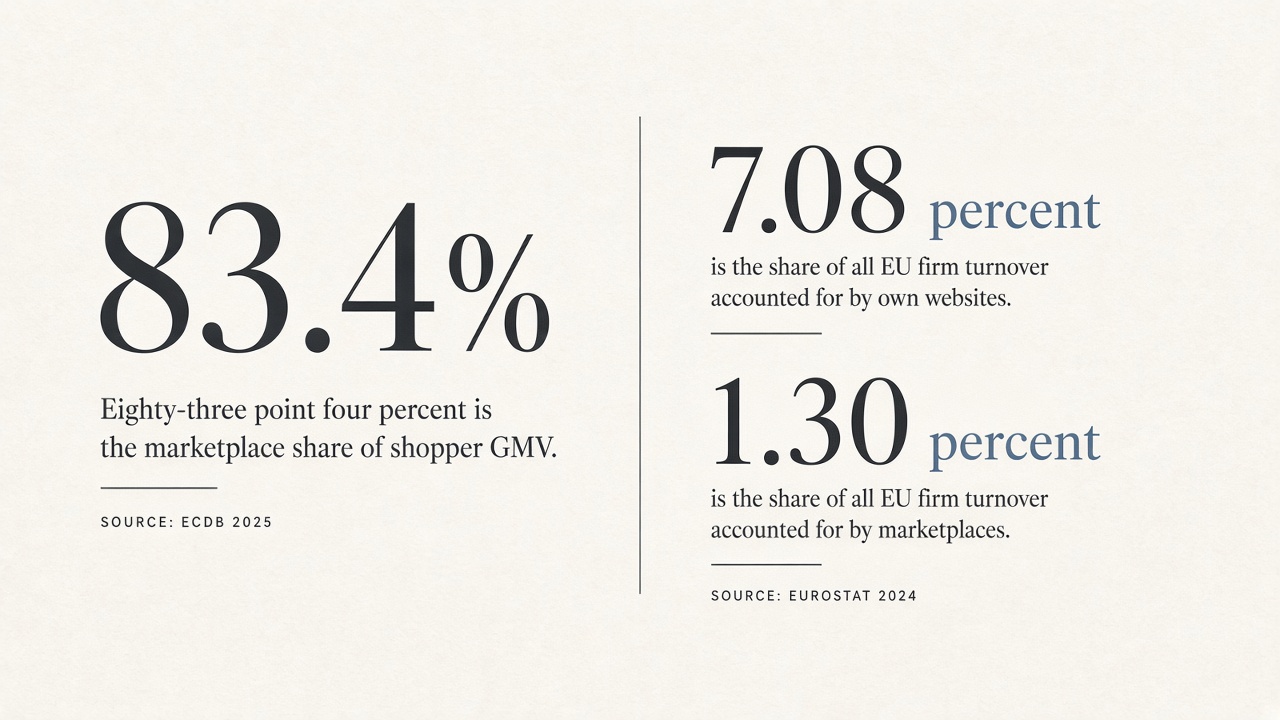
Start with the figure itself. It comes from ECDB, a research firm that counts online retail spending worldwide, and its unit is shopper GMV: the value of goods at the moment of checkout, sorted by where the checkout happens. For 2025, ECDB puts marketplaces at 83.4% of that spending and first-party online stores at 16.6%. Two years earlier the split was 81 to 19. So the shift is real, and it is recent. No hedge is needed here, and none is offered: globally, shoppers increasingly check out on marketplaces.
That unit matters, so keep it in view. A count of baskets never asks who the merchant is, what margin survived the sale, or whether the customer will ever come back. It records where the checkout happened, and it stops there.
The interesting part is what the same dataset says next. Broken down by region, the 83.4% stops being one story. Asia checks out on marketplaces 97% of the time. The Americas sit at 67.8%. Europe sits at 60.8% – up from 56.2% in 2023, so Europe is moving too, just from a very different place. ECDB’s own explanation for the gap: in Europe, heritage brands grew up running their own sites, while in Asia platforms like Taobao, Tmall, JD and Pinduoduo were the rails from the start. Commerce there was born marketplace-shaped.
ECDB. Shopper GMV: value at checkout, by where the checkout happens.
Read that again, because it is the first gift hidden in the data. The dataset that produces the scary headline also contains the counter-evidence: where merchants built direct first, direct persists at scale. Europe’s 60.8% is not a delayed 97%. It is what happens when an economy of shopkeepers meets the marketplace late, with the shop already built and the customer file already full.
One honest note on the Americas, since that figure lumps two continents together. In Latin America, Mercado Libre is the regional default the way Amazon is in the United States; in both places the marketplace is infrastructure, closer to Asia’s story than to Europe’s. The 67.8% describes rails more than preferences.
So the big number is mostly a story about where ecommerce grew up on marketplaces. It counts baskets at the checkout. It answers the question “where do shoppers buy,” and it answers it well. It does not answer “what is a merchant’s business made of” – and it says nothing, nothing at all, about what shopkeeping has to be. Or shorter: the 83.4% counts baskets. You are not a basket.
Where this comes from. ECDB counts consumer spending at online checkouts – shopper GMV – not the turnover of firms. Its 2025 split is 83.4% marketplaces against 16.6% first-party stores (81 to 19 in 2023), with regional figures of 97.0% for Asia, 67.8% for the Americas and 60.8% for Europe, up from 56.2% two years earlier, also covered by Ecommerce News. It is one pie: where shoppers buy. It is not the other pie, which comes next.
Count the firms instead
Now cross the street, to the building where they count firms instead of baskets. Eurostat, the European Union’s statistics office, measures e-commerce against the total turnover of enterprises – all of it, not just the online slice. Its 2024 results describe a different economy. Of all EU enterprise turnover, web sales account for 8.39%. Own websites and apps carry 7.08 percentage points of that. Marketplaces carry 1.30.
Put those two figures side by side and let them sit for a moment. In turnover terms – the terms in which a business pays its suppliers and its staff – the independent webshop is more than five times the size of the marketplace. The store is not a romantic holdout. On the firm side of the ledger, it is the statistical majority of how European companies sell online.
The gap is not mysterious once you remember what turnover includes. Manufacturers invoicing distributors. Wholesalers. Service firms taking bookings. The European economy is mostly businesses selling to other businesses and to regulars – and the instrument that sees all of them sees the own site everywhere and the marketplace at the margin.
Then Eurostat adds the number that quietly resets everyone’s scale. EDI-type sales – the structured, system-to-system orders of ordinary business-to-business trade – account for 11.07% of turnover, more than all web sales combined. The loudest channel was never the whole economy. Most European commerce still moves in ways no marketplace ranking will ever see – and nobody has ever written a breathless headline about EDI.
Eurostat. The rest of turnover is not web sales. Scale is 12% of all turnover, so the bars stay comparable.
Look only at firms that sell online at all, and the pattern repeats. Among EU enterprises with web sales, 85.65% sell through their own website or app, while 45% use a marketplace. Firms do both, so the two add up to more than a hundred. But watch which behavior is nearly universal, and which one is optional.
The country spread is the second gift. Marketplace use among web-selling firms runs from Lithuania at 86.6%, Italy at 65.1% and Poland at 63.6%, all the way down to Estonia at 16.5%, Sweden at 24.8% and Croatia at 25.7%. Read it flat: in Estonia, five web-selling firms in six never list on a marketplace. In Sweden, three in four never do. Same single market, same decade, same internet. The marketplace turns out to be a habit with strong regional patterns – not a law of nature. And whatever five firms in six is, it is not a fringe.
| Country | Share that list |
|---|---|
| Lithuania | 86.6% |
| Italy | 65.1% |
| Poland | 63.6% |
| Croatia | 25.7% |
| Sweden | 24.8% |
| Estonia | 16.5% |
Eurostat. Same single market; not a law of nature.
A word on instruments, because precision is the merchant’s friend. Other measurers get lower figures: eMarketer puts the third-party share of Western European ecommerce near 39%, under a definition quite different from ECDB’s. The two are never mixed in this piece, and they should not be mixed anywhere else either. Each instrument measures a named thing – shopper spending at the checkout, or all-enterprise turnover, or third-party share within one region. The headlines depend on blur. Once every number carries its definition, the story gets quieter, and truer.
Where this comes from. Eurostat counts the turnover of all EU enterprises, not ecommerce spending: web sales are 8.39% of total turnover, split 7.08% own sites and 1.30% marketplaces, with EDI-type sales at 11.07% (restated by Cross-Border Magazine). Among firms with any web sales, marketplace use runs from Lithuania 86.6%, Italy 65.1% and Poland 63.6% down to Estonia 16.5%, Sweden 24.8% and Croatia 25.7%. A different pie from ECDB’s, deliberately so – and eMarketer’s ~39% is a third definition again.
Three honest businesses
The two counts overlap only partly, and so do the two merchant populations – marketplace sellers and store owners. Nobody publishes an honest count of that overlap, and this piece will not invent one. Where the overlap number is missing, vibes move in. What the data can support is a portrait of three businesses. All three are real. All three are honest ways to run a company. Only one idea gets banned here: the inference from “shoppers start there” to “your store is obsolete.”

The listing-only business: the marketplace is the company
Amazon opened its Marketplace in November 2000, and for two decades the series ran one way. Third-party sellers reached 62% of worldwide paid units in the last quarter of 2024 – the peak of a series Marketplace Pulse has tracked since 2004 – and then slipped to 60% by the first quarter of 2026, the first back-to-back decline on record. Marketplace Pulse estimates third party at roughly 69% of GMV against about 60% of units, the gap explained by groceries and Amazon’s own retail mix, and third-party services revenue still grew 12% through the dip. Fairness first: the marketplace is not dying either.
But it is consolidating. Marketplace Pulse’s running count, based on seller feedback activity rather than registrations, puts active sellers at about 1.65 million at the end of 2025, down from 2.4 million in 2021. Fewer sellers, more volume each.
Life inside the model is its own discipline. ChannelEngine’s 2025 survey asked 470 companies that already sell on marketplaces – a panel of believers, not a count of every shop – in France, Germany, the Netherlands, the UK and the US. The average seller there lists on six marketplaces at once. Only 2% sell on just one; 34% sell on seven or more.
The tooling tells the same story. 62% of these sellers run a marketplace integrator to keep the operation stitched together, 52% still run spreadsheets alongside it, and 91% call automation critical. Nobody runs six marketplaces from an open browser tab.
The pressure also comes from below. Under the EU’s Digital Services Act, the biggest platforms publish their monthly users – attention, not turnover – and the European Commission’s list reads like a new map: Amazon Store 181.3 million, Shein 108 million, AliExpress 104.3 million, Temu 75 million. The Commission’s customs count adds the weight behind the attention: 4.6 billion low-value consignments under €150 entered the EU in 2024, 91% of them from China.
The honest reading, stated once: this is a real business and a hard one – consolidated, automated, crowded at the bottom. Its structural fact is not a statistic. When the account is the company, an account decision is a business decision, made by someone else.
The shop-only business: never lists, statistically normal
Now consider the business the headlines forget. The shop that never lists is not a holdout; in the country spread above, it is simply how most Swedish, Estonian and Croatian web-sellers already work. Store Leads crawls live websites – crawls, not company filings – and currently counts about 3.03 million active Shopify stores, up 11% year on year; about 4.09 million WooCommerce stores, down from a peak of roughly 4.78 million in 2024; about 151,000 PrestaShop stores, shrinking on that crawl. No sanding this down: the independent web is not one rising curve. It is contested ground, and your own platform may be the shrinking line on the chart.
The filing-grade numbers tell the other half. Shopify’s reported GMV for 2025 was $378.4 billion, up 29% on the year – $123.8 billion of it in the fourth quarter alone, up 31% – and the first quarter of 2026 added another $100.7 billion. GMV here means orders facilitated through the platform, including certain apps and channels, net of refunds – Shopify publishes no split between its own storefronts and sales it merely pipes elsewhere, and its B2B volume, though it nearly doubled in 2025, remains what the company itself calls a very small portion of the total. By its own arithmetic, more than 14% of US ecommerce outside point-of-sale now runs through it. And the money arrives the slow way: a storefront earns its orders through the patient work of improving conversion page by page – which is exactly the work a marketplace template takes off your desk and out of your hands.
Whatever instrument you trust – crawl or filing – millions of firms run their own storefront, and the largest storefront platform grew 29% in the same year the 83.4% was doing the rounds. Shop-only is not nostalgia. It is a large, boring, growing normal.
The shop that also lists: extra demand, not a replacement
The third business lists, and keeps the shop. The hierarchy matters, so state it plainly: the shop is the system of record – the catalog, the customer file, the stock. The marketplace is demand plugged into that system. Notice that the ChannelEngine figures quietly prove the hierarchy: integrators and automation matter precisely because a shop has to exist first for there to be anything to integrate.
And give marketplaces their genuine due. Around 70% of European online cross-border revenue flows through them – about €247.5 billion in the 2024-25 fiscal year, reported by Ecommerce News from Cross-Border Commerce Europe’s data. For a European merchant, marketplaces are the export rails of the single market. That is a real reason to list. A reason to list is not a reason to dissolve. Demand that arrives through a marketplace arrives without a customer relationship attached; the shop is what can turn one exported order into a second, direct one.
| Listing only | Shop only | Shop that also lists | |
|---|---|---|---|
| Customer file | The platform | You | You |
| Price | Platform rules | You | You, plus listing rules |
| Catalog voice | A template | Yours | Yours in the shop |
| If the platform says no | The company ends | The shop continues | The listing ends; the shop continues |
A comparison. Not a diagram that says to do both.
Where this comes from. Marketplace Pulse counts Amazon’s third-party share in paid units and estimates the GMV split; its active-seller figure uses feedback activity, not registrations (summary via AMZ Prep). ChannelEngine polled companies already selling on marketplaces – a panel, not a count of all webshops. Store Leads crawls live sites, so its counts are detections, not filings (WooCommerce and PrestaShop reports). Shopify’s GMV is orders facilitated through its platform, with no published split between storefront and channel (Q1 2026 press release). The Brussels figures are monthly users, not GMV. None of these is Eurostat’s pie, and none is ECDB’s.
What it would take to replace your own online store
Which brings the argument to the word that started it: replace. Replace is a claim about functions. For a marketplace to replace your store, it would have to take over what the store does. Run the test plainly, one function at a time.
Look first at what the test does not ask. It does not ask where shoppers prefer to click, or which app opens fastest on a phone. Those are real questions, and the first section answered them. But replace is a stronger claim than popular. A replacement has to do the job.
| Function | Own store | Marketplace listing |
|---|---|---|
| Customer file | Yes | No |
| Pricing authority | Yes | No |
| Catalog in your voice | Yes | No |
| Repeat margin you own | Yes | No |
| An asset you can sell | Yes | No |
| Survives a platform decision | Yes | No |
Detail below.
- The customer file. Who bought, what they bought, permission to write to them again. A marketplace order is a settlement ID and a payout date. A store order is a name. When a customer writes to ask where a parcel has gone, that message belongs to whoever owns the relationship – and on a marketplace, it is not you.
- Pricing authority. Your margin arithmetic, your promotions, your price history, your loyalty tiers – with no referral layer sitting inside every price, taxing each basket before you ever see it.
- The catalog in your own voice. Your photos, your fitment tables, your cross-sells, your delivery promises, your returns policy – not a template one row above a €4 item with the same title.
- Repeat margin. The second order is the cheapest order a merchant ever gets, and it only comes to an address you own.
- An asset. A store with a customer file can be valued, sold, borrowed against, inherited. The whole question of buying versus building your own ecommerce platform exists only because ownership changes what a business is worth. An account can be reviewed.
- Continuity. The asymmetry, stated once and flat: a marketplace can end a listing-only business on its own decision. No marketplace can end your store on its decision. The risk runs one way.
None of these six functions appears in the 83.4%. The headline number measures where first purchases happen. A business is made of what happens after the first purchase. Even if the global figure keeps climbing toward Asia’s 97% – and it may – not one of the six moves across. The customer file stays where it was built. The margin arithmetic stays where it is owned. What changes is only where the first knock on the door comes from. A marketplace sells you demand by the click. The store is where demand, once bought, stays. Where shoppers start is not where a business lives.
The ledger test

The easy ending would be a sermon about doing both – a channel for every occasion, the best of both worlds. Skip it. The two counts suggest a plainer test, and it fits in one question: where is your business written down? The catalog, the customers, the stock, the money – whose database holds them tonight?
If all of it lives inside someone else’s account, you have a stall on a busy street, and the street belongs to someone else. That can still be an honest living; the portraits above said so and meant it. But now you know exactly what it is, and what a single decision can do to it.
If it lives in your own online store, then every marketplace you ever list on is a street you send some stock to. Extra demand, not a replacement – which is what the title of this piece claims, and what the firm-side numbers back.
This evening, the two files are still on the screen. The settlement report says sales. The order export says sales, and lists the people – including the customer from 2021, who wrote about a spare part and will write again, perhaps with the oldest question in ecommerce, where is my order. Both files are true. Only one of them is a business. Shoppers can start wherever they like. A business has to live somewhere.
A note on the counting. This piece uses several instruments and never swaps one for another: ECDB counts shopper spending at online checkouts; Eurostat counts the turnover of all EU enterprises; Store Leads crawls live storefronts; ChannelEngine polled 470 companies already selling on marketplaces; the platform figures from Brussels are monthly users, not turnover. Where a definition could change a number’s meaning – GMV versus units, crawl versus filing, users versus money – the definition travels with the number. The 83.4% and the 7.08% are both true. They were never measuring the same thing.